On September 22nd, a new version of P&D portal (03.2020) was released with some major data and functionality updates, among these with a new Probes tab, probe criteria filters, and an advanced export.
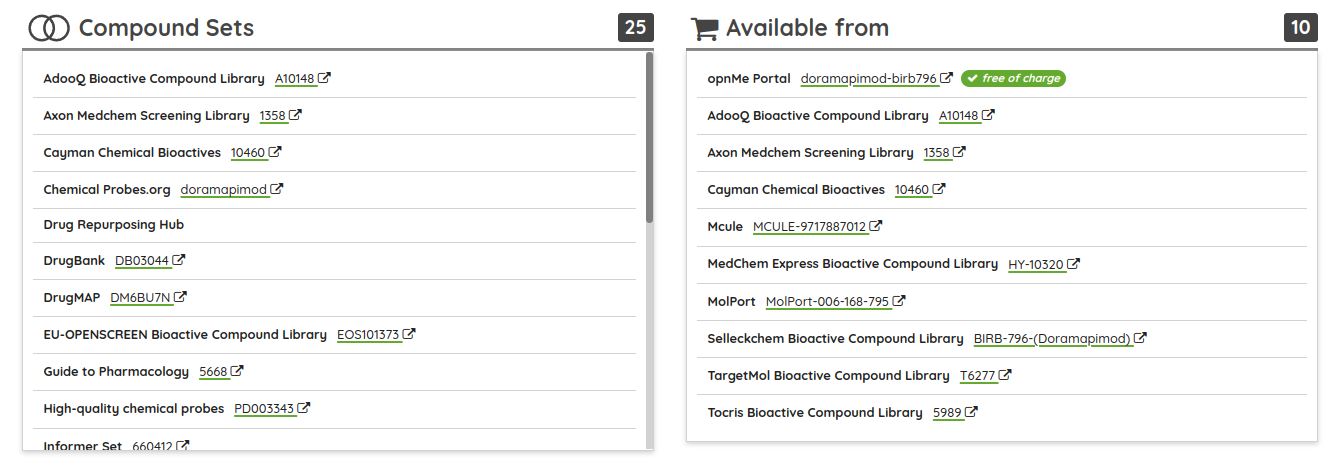
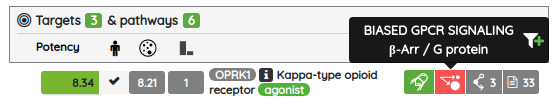
Concerning the data updates, all of the major data sources were updated to their current versions (ChEMBL 27, GtoPDB 2020.03, DrugBank 5.1.7, and others) along with many of the compound sets, including the probe sets such as Chemical probes.org, Open Science Probes, SGC probes, and opnMe portal. We also added one brand new compound set of biased GPCR ligands from BiasDB (BiasDB: A Comprehensive Database for Biased GPCR Ligands). "BiasDB is a manually curated database containing all published biased GPCR ligands. BiasDB currently contains 654 bias cases of signaling bias representing 489 individual ligands for 61 receptors. We provide information about the chemical structure, target receptor, type of bias, assay categories used for bias determination, reference ligand, and literature source. BiasDB is a resource for medicinal chemists, pharmacologists, and researchers interested in biased GPCR signaling."
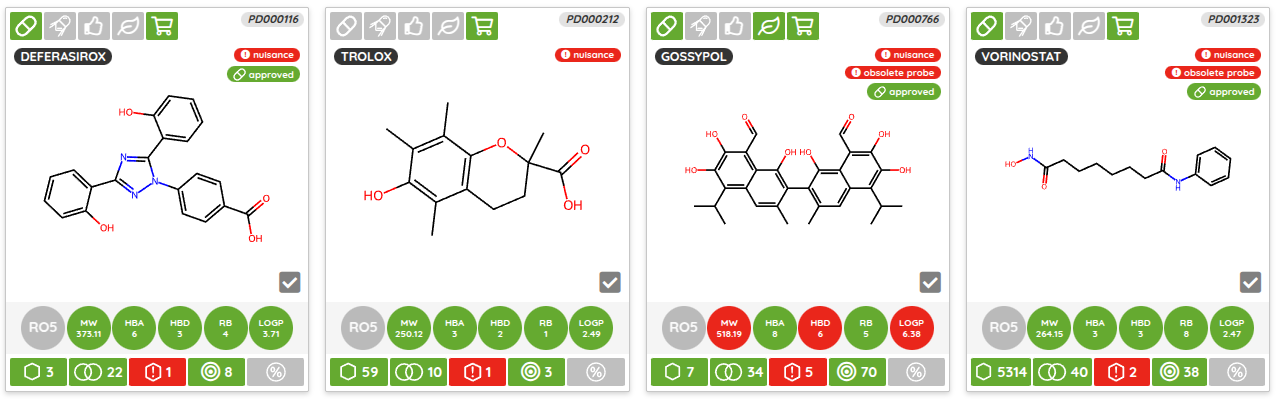
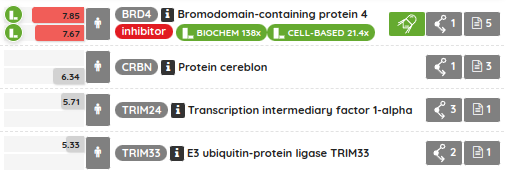
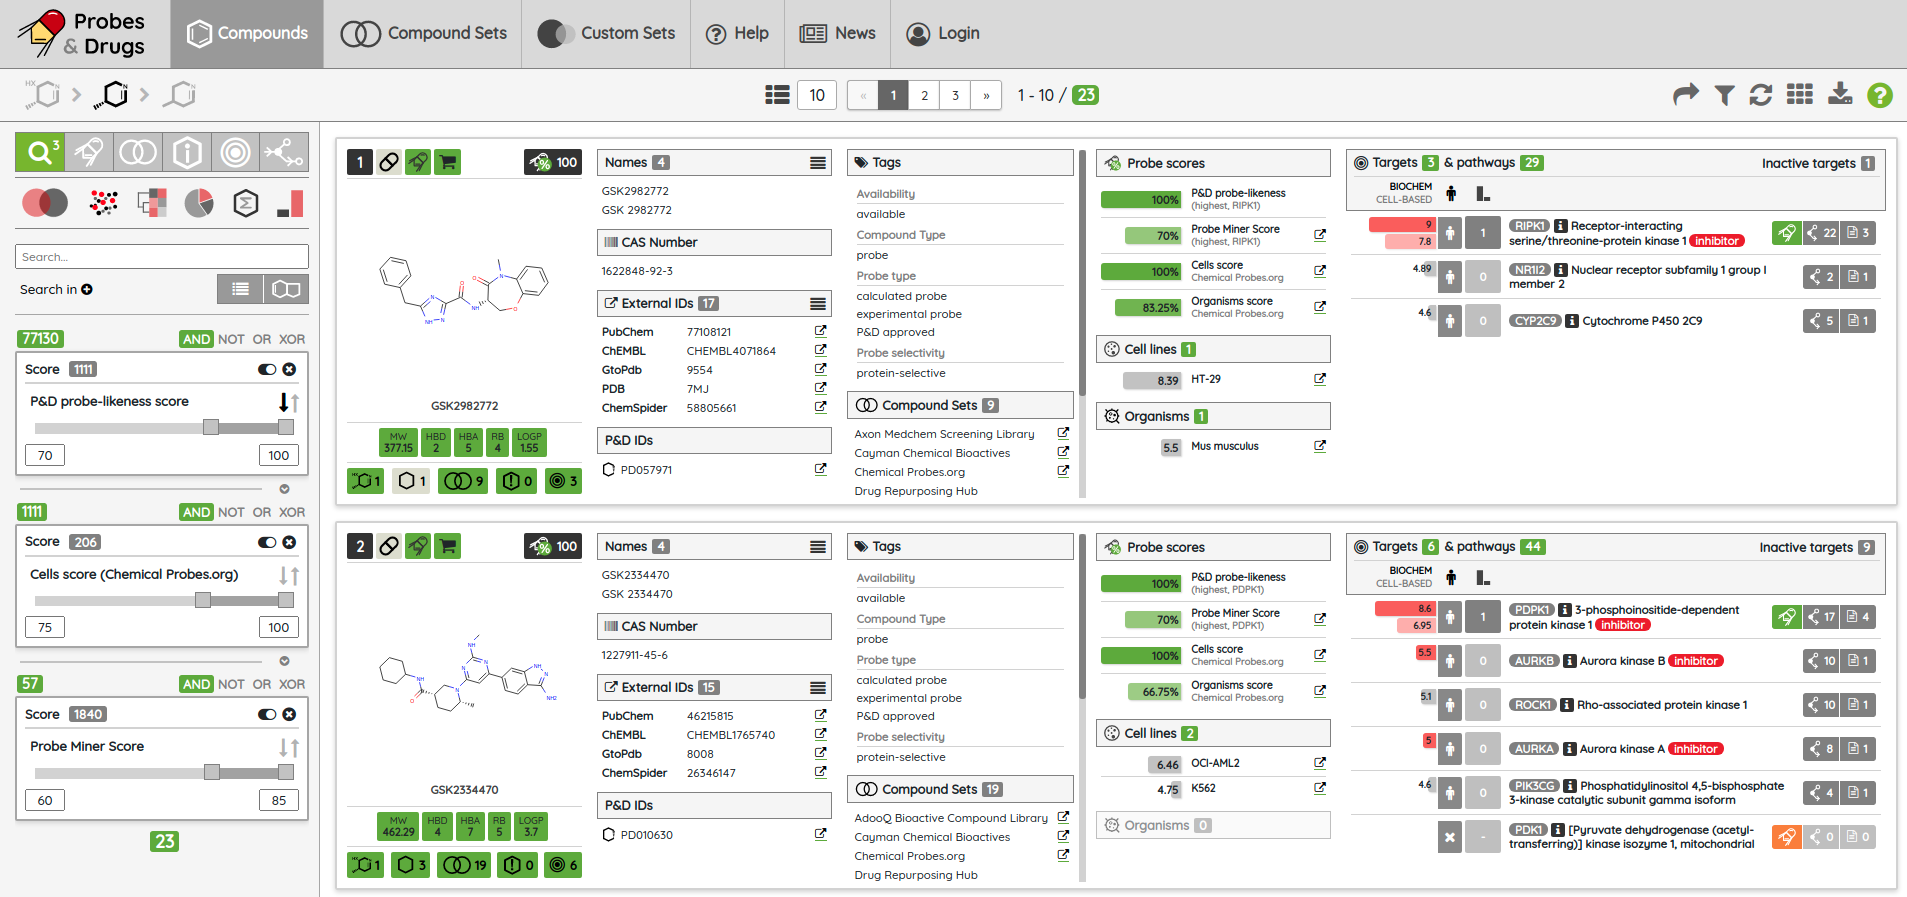
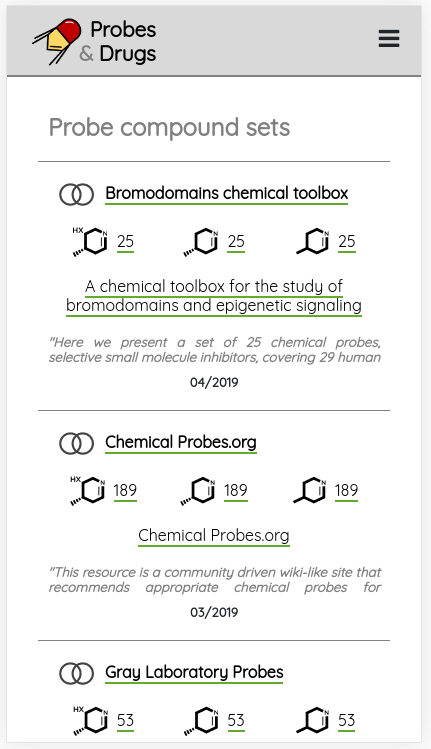
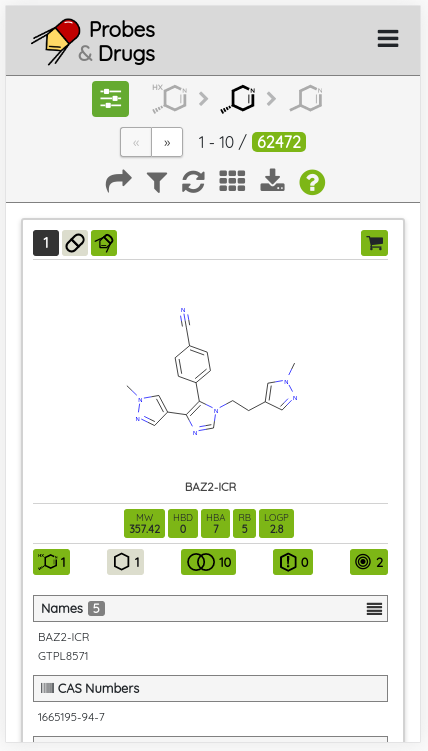
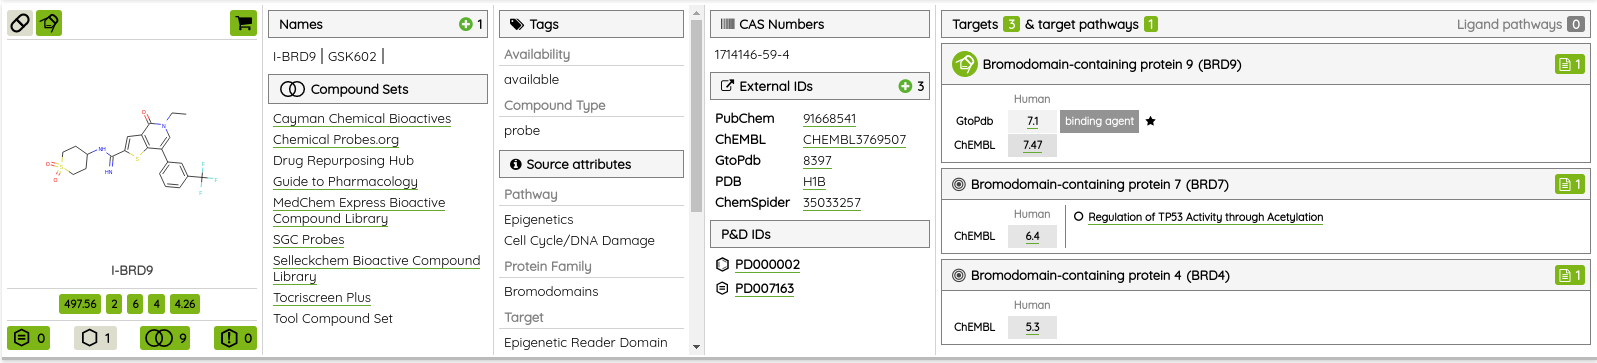
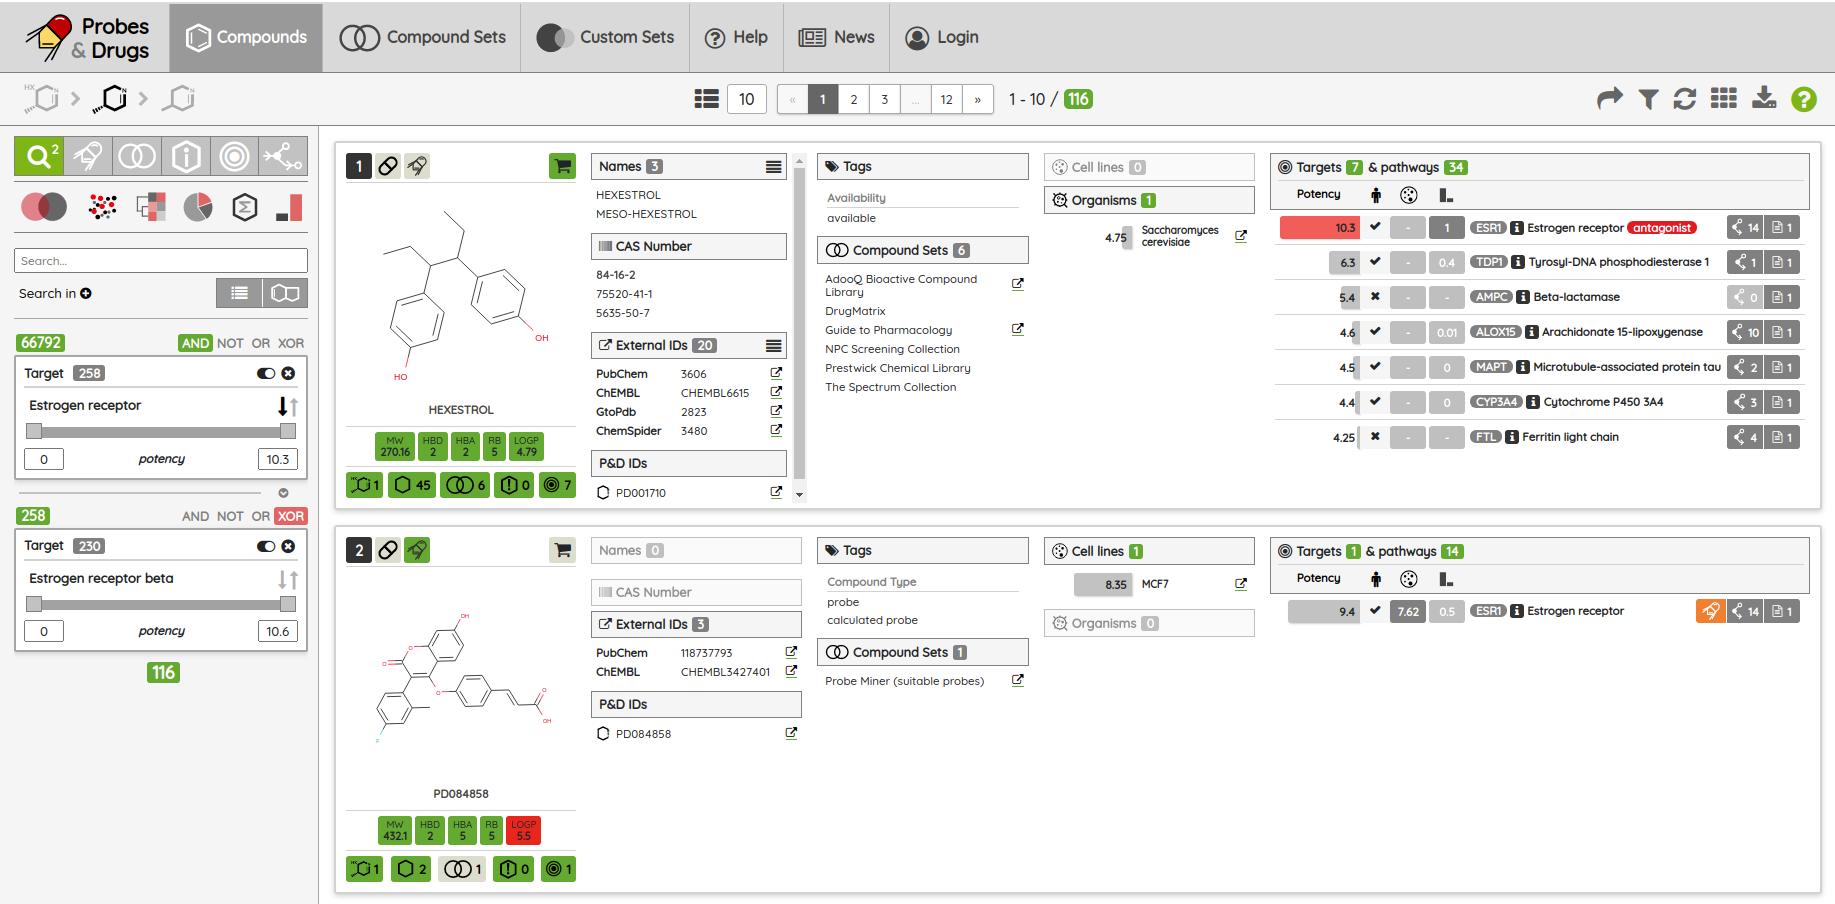
One of the major functionality updates is the addition of the Probes tab in the Compounds view along with probe specific filters: probe criteria and probe targets. In the Probes tab, all probe specific filters are pre-loaded to be applied on a pre-filtered set of probes.

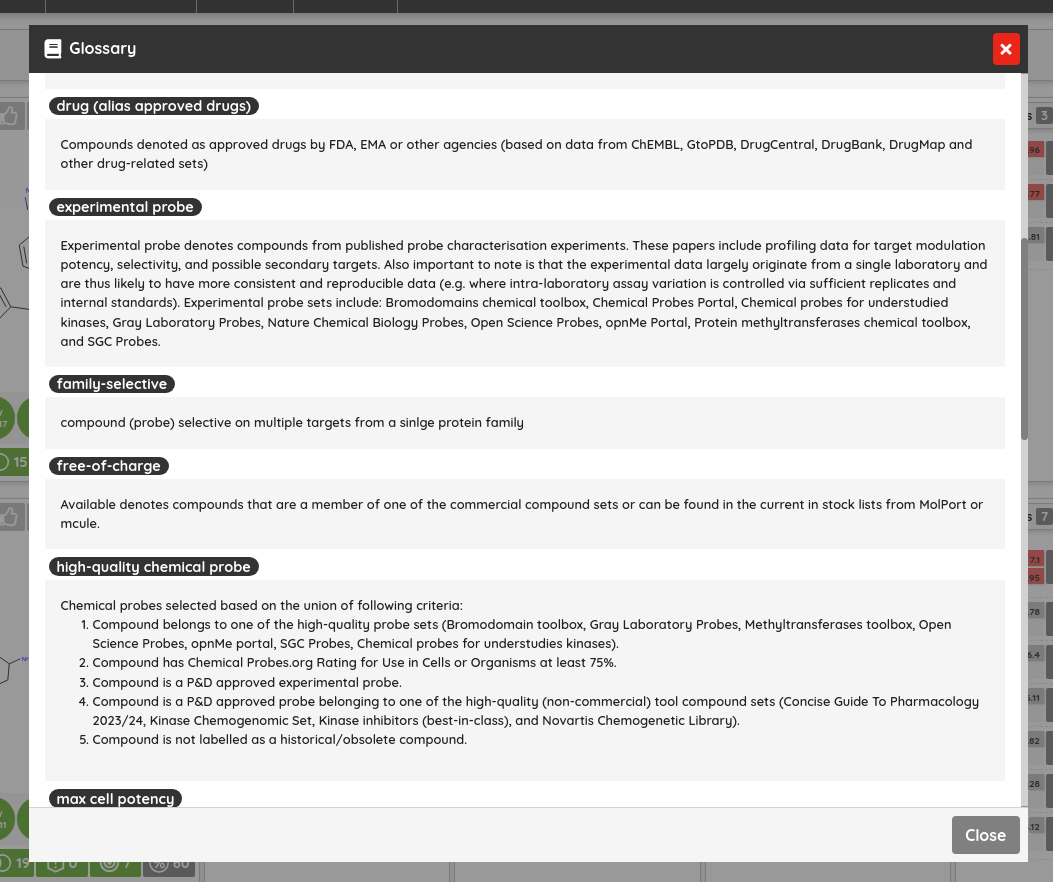
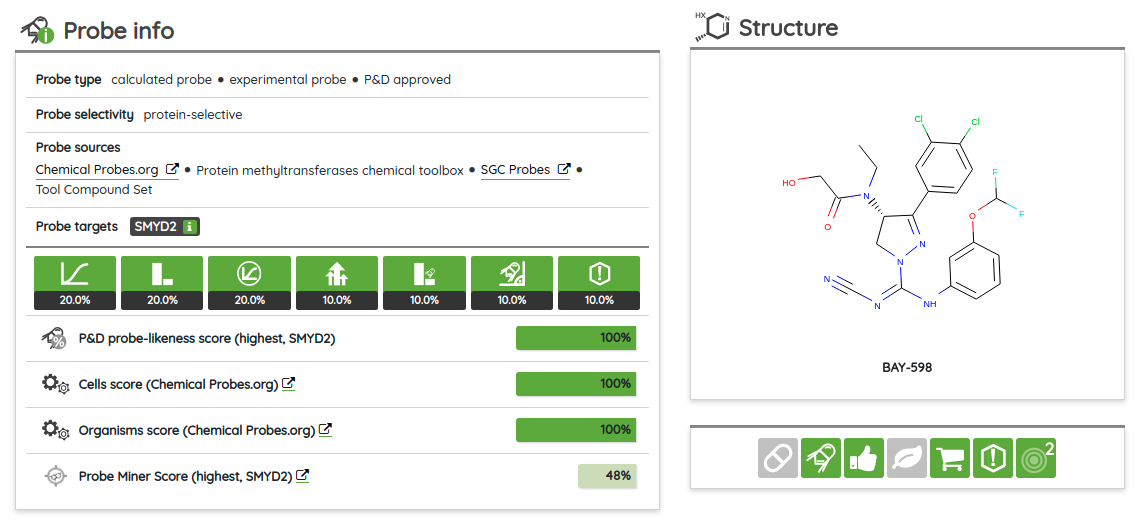
There are many possible criteria that can be considered when labeling compounds as chemical probes. On P&D, we tag compounds as probes based on their membership in one of the probe sets (i.e., all compounds that belong to a probe set, such as Chemical probes.org or SGC probes, are tagged as probes), and the provided probes criteria filters can be used to filter them based on the available data. Currently, there are 8 probe criteria filters available (name - description):
-
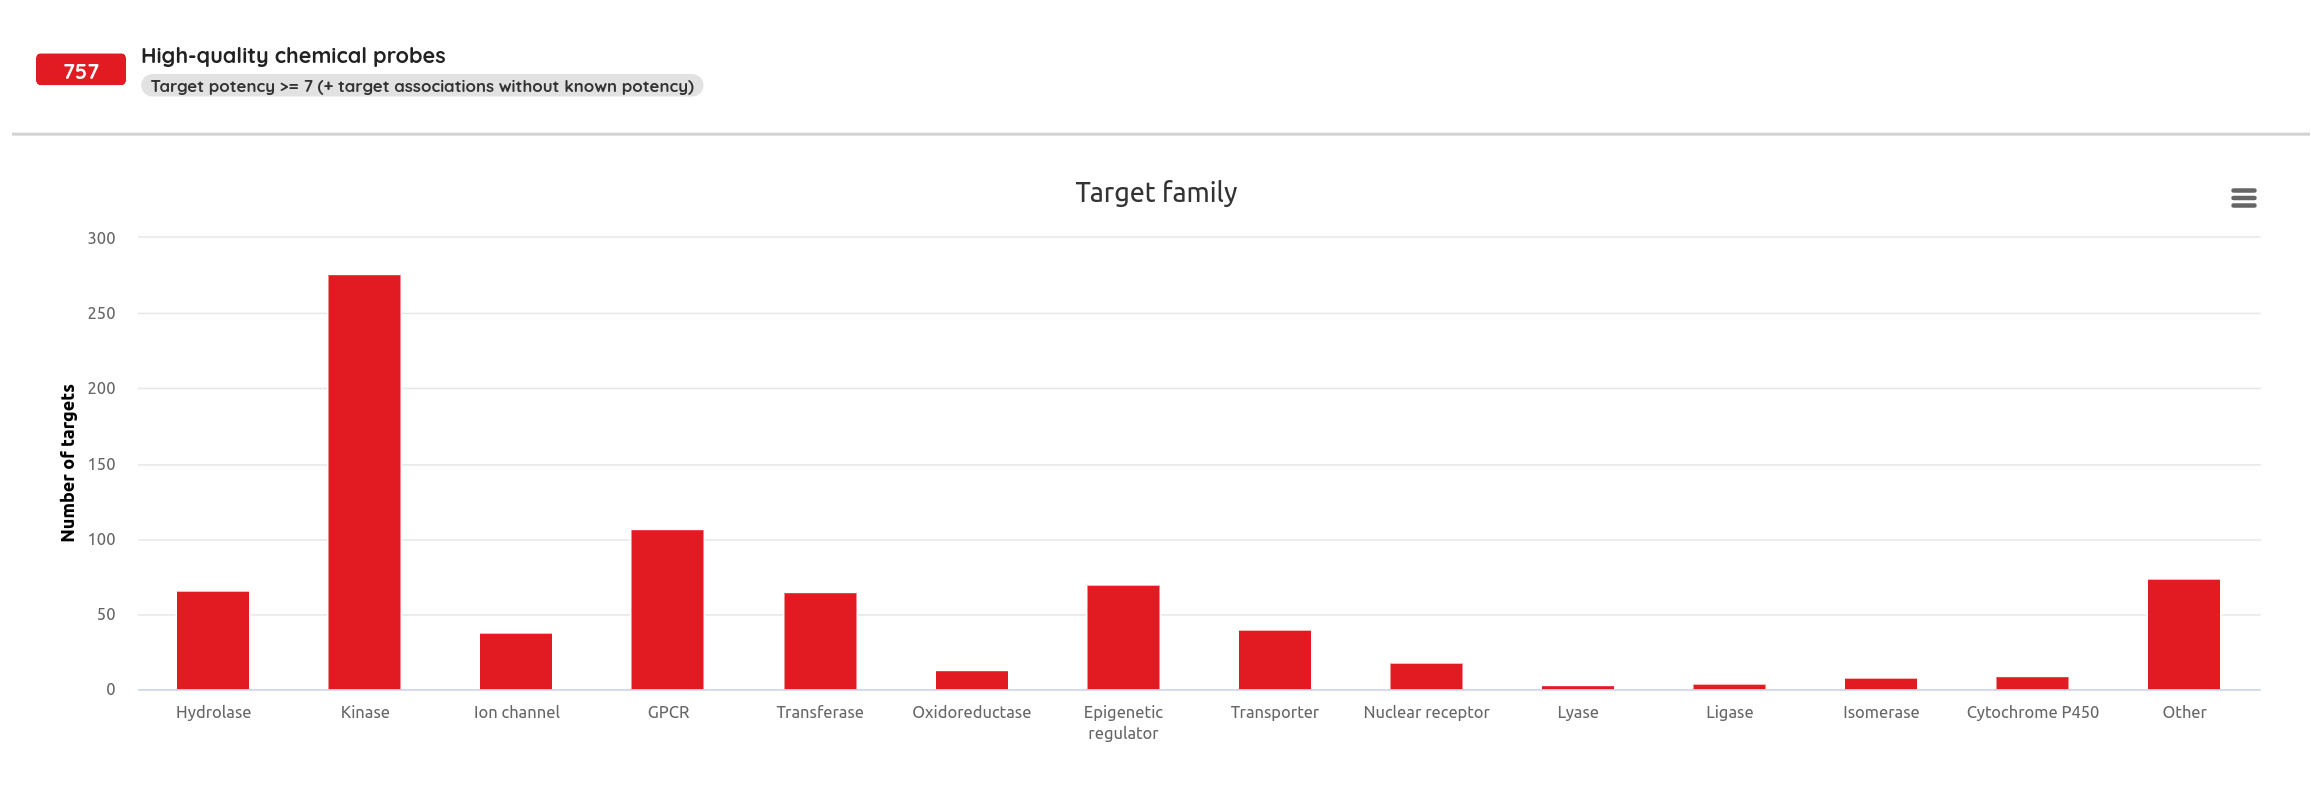
Potency >= 7 [100 nM] - potency in a biochemical assay greater than 100 nM (value 7 on a -log() scale).
-
Cell potency >= 6 [1 µM] [ON TARGET] - on-target potency in a cell-based assay (i.e., potency in a cell-based assay with a specified protein target) greater than 1 µM (value 6 on a -log() scale).
-
Cell potency >= 6 [1 µM] [GLOBAL] - potency in a cell-based assay (i.e., potency in any cell-based assay) greater than 1 µM (value 6 on a -log() scale).
-
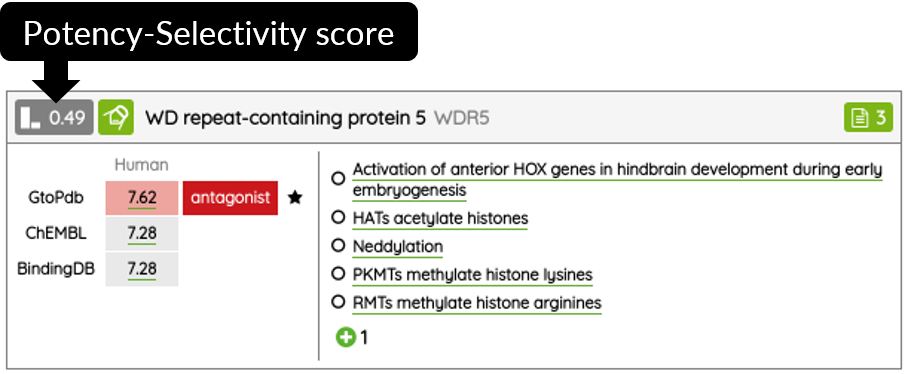
Is selective [> 30 fold] - selectivity for the probe target is at least 30-fold (~1,47 difference on a -log() scale).
-
Has inactive control - defined inactive control in the compound’s source data.
-
Has orthogonal probe - there is at least one other probe for the same target that doesn’t share the same molecular scaffold and is at most 40% similar to the first probe (ECFP4, Tanimoto similarity).
-
No alert [PAINS/Aggregator] - the probe doesn’t contain any PAINS alert and/or is not tagged as an aggregator.
-
Not obsolete - the probe is not tagged as obsolete.
These filters can be used in the Probes tab, but, like any other filter, also in the main tab (either found through the text search or added from the Probes tab).
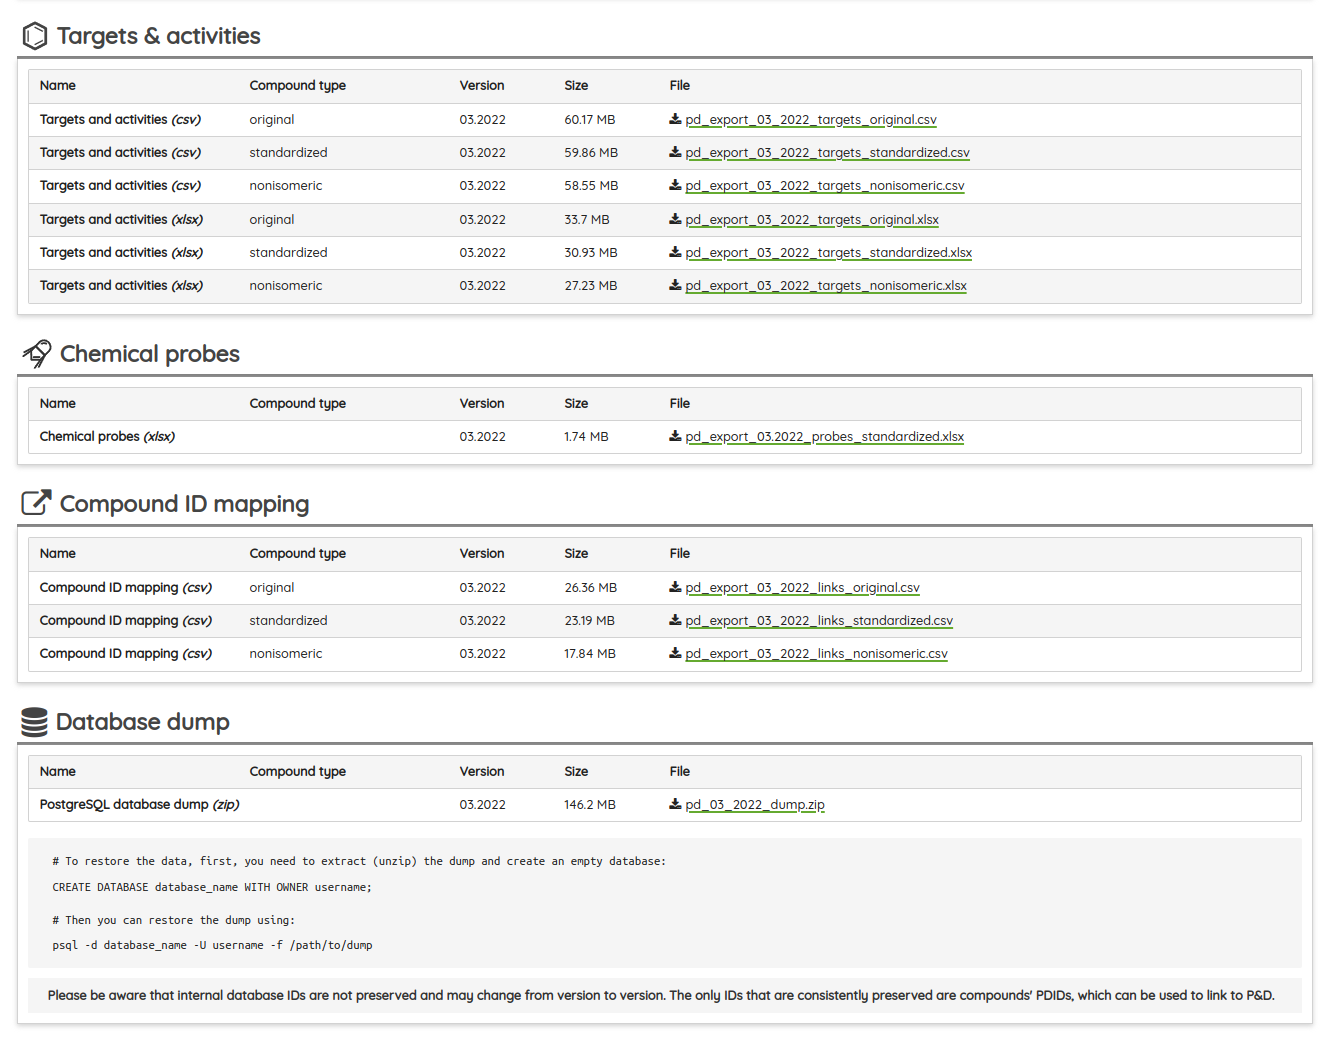
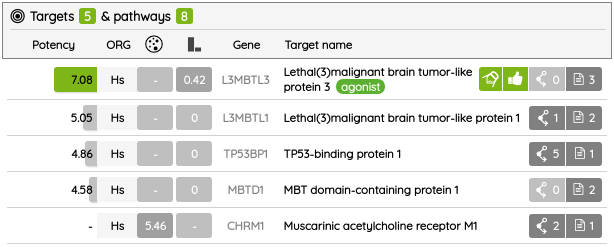
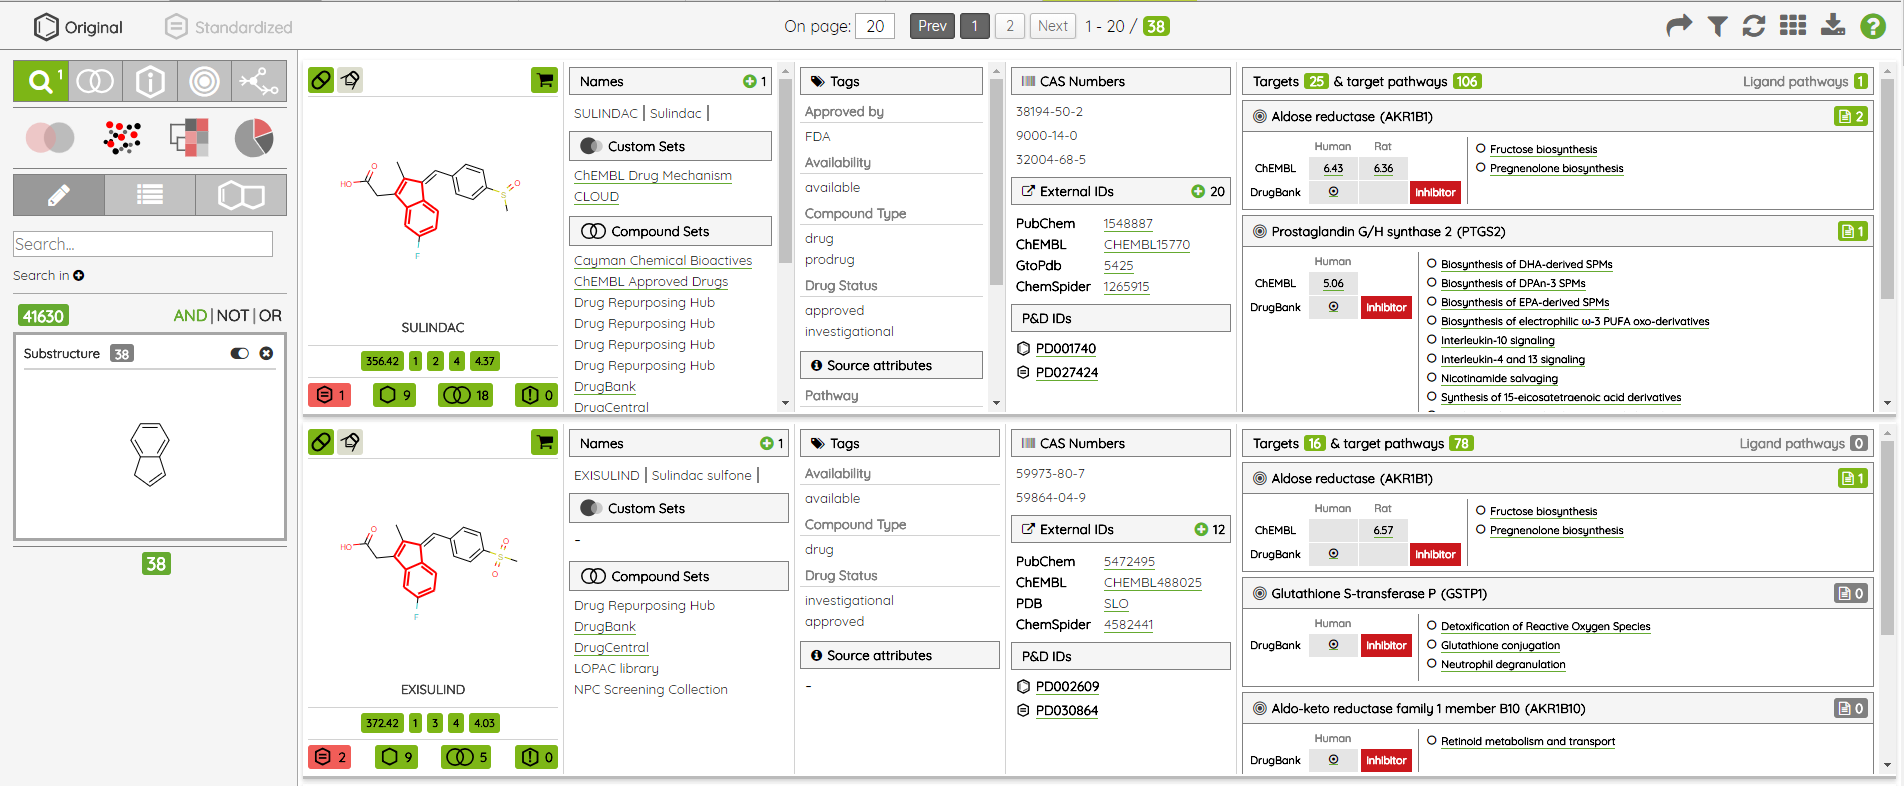
From version 03.2020, the Export functionality was also upgraded. Beside basic compounds’ information, now, it is also possible to export their associated target data for protein targets in two formats, text (.csv) and Excel file (.xlsx). In the target file, there are not only information about target/gene name, activity value, MOA, and probe tag, but also its classification in the ChEMBL/GtoPBD target trees and associated Reactome pathways.
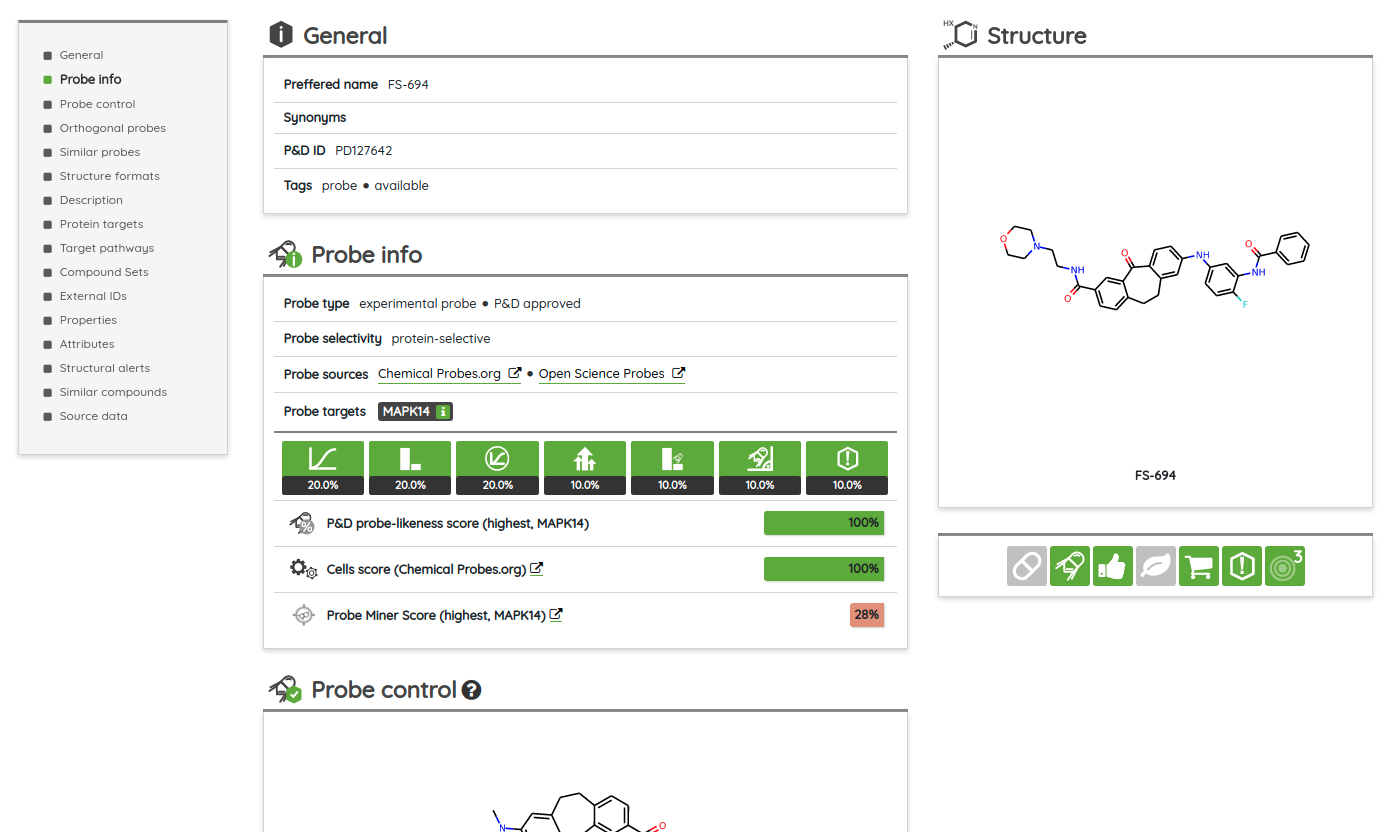
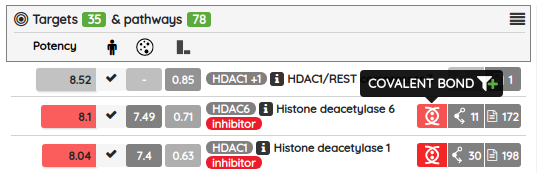
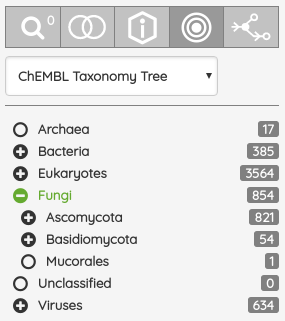
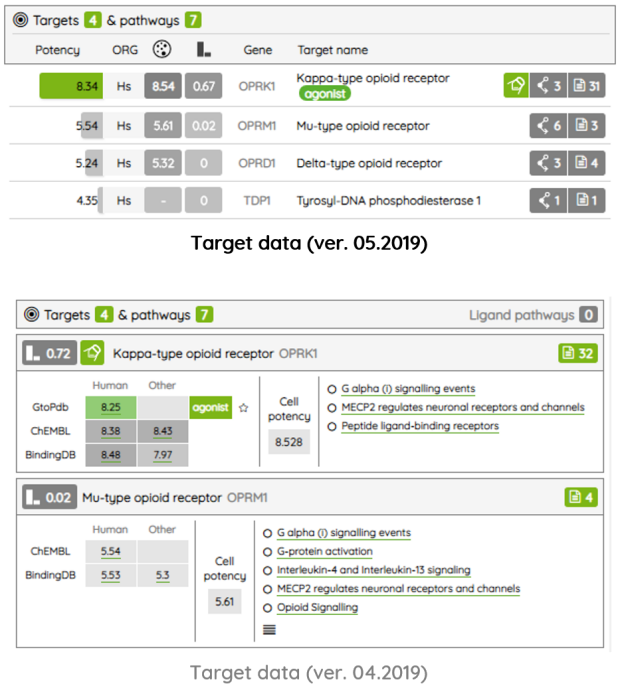
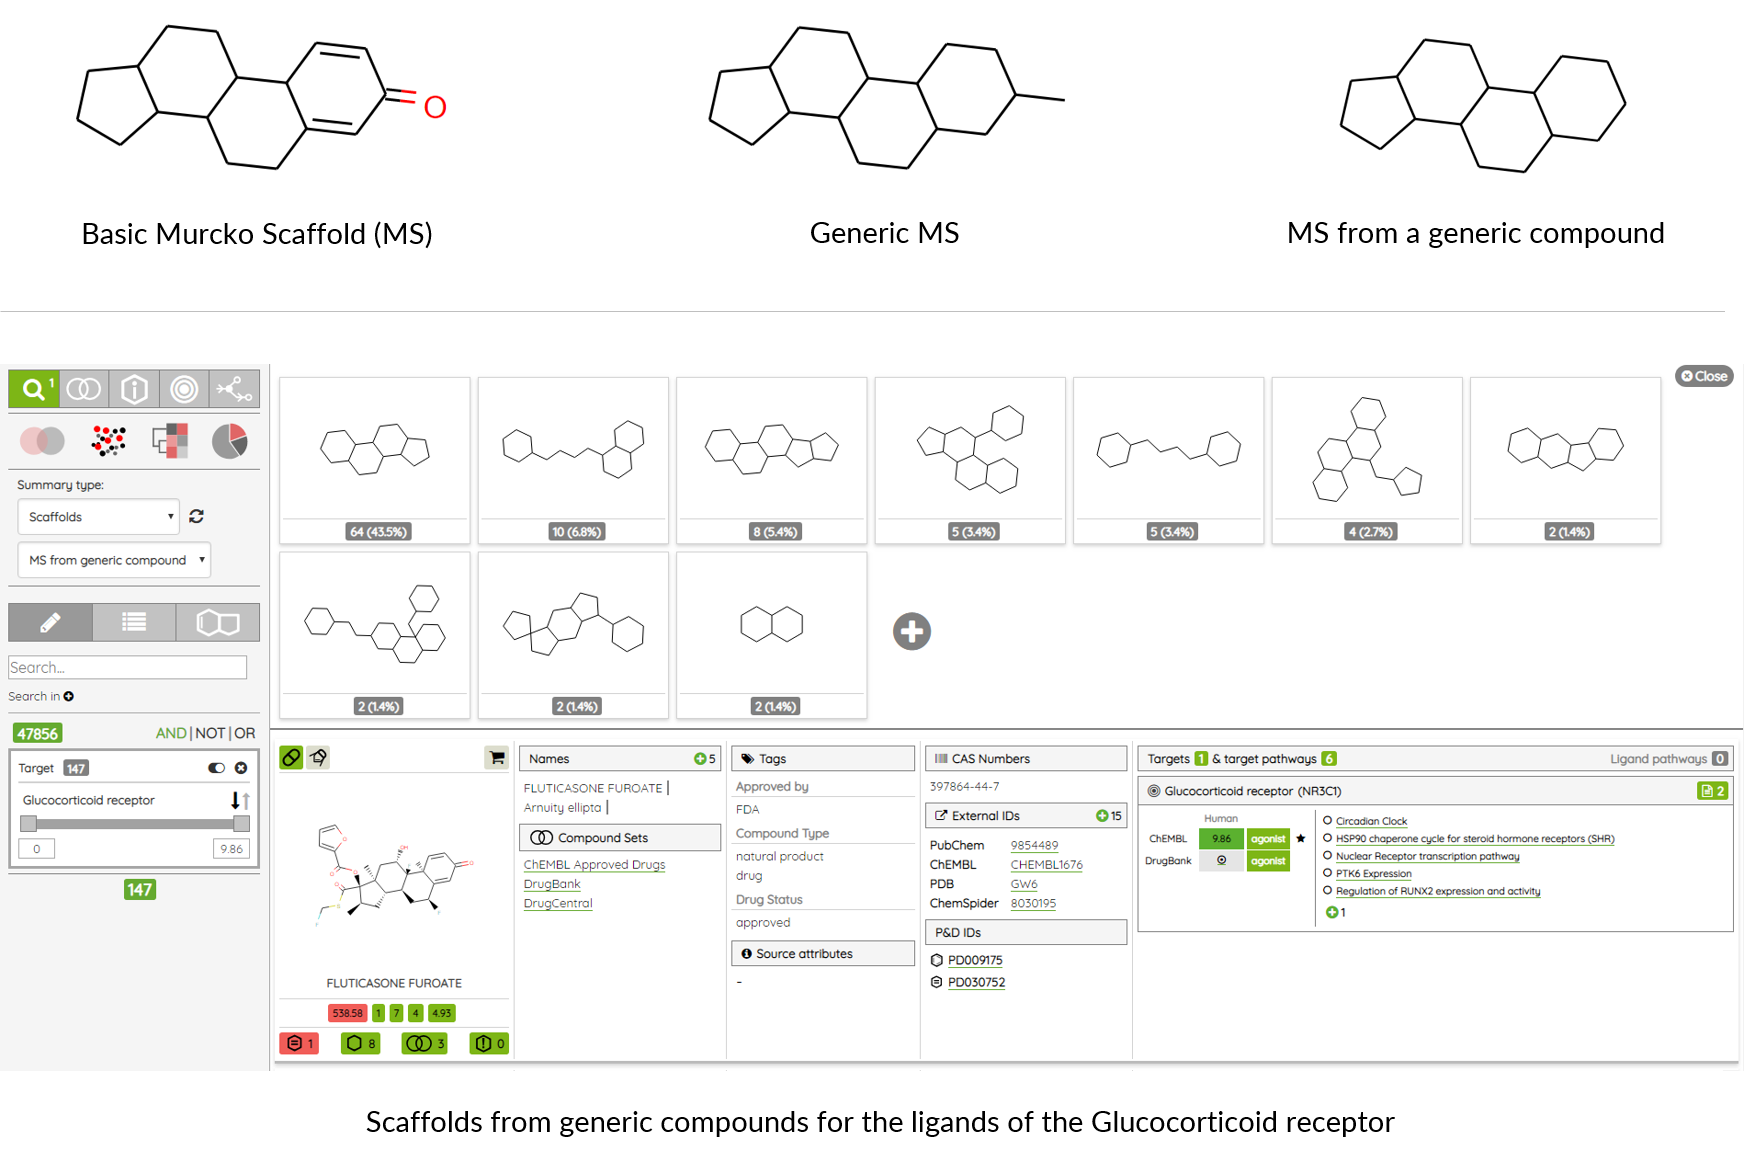
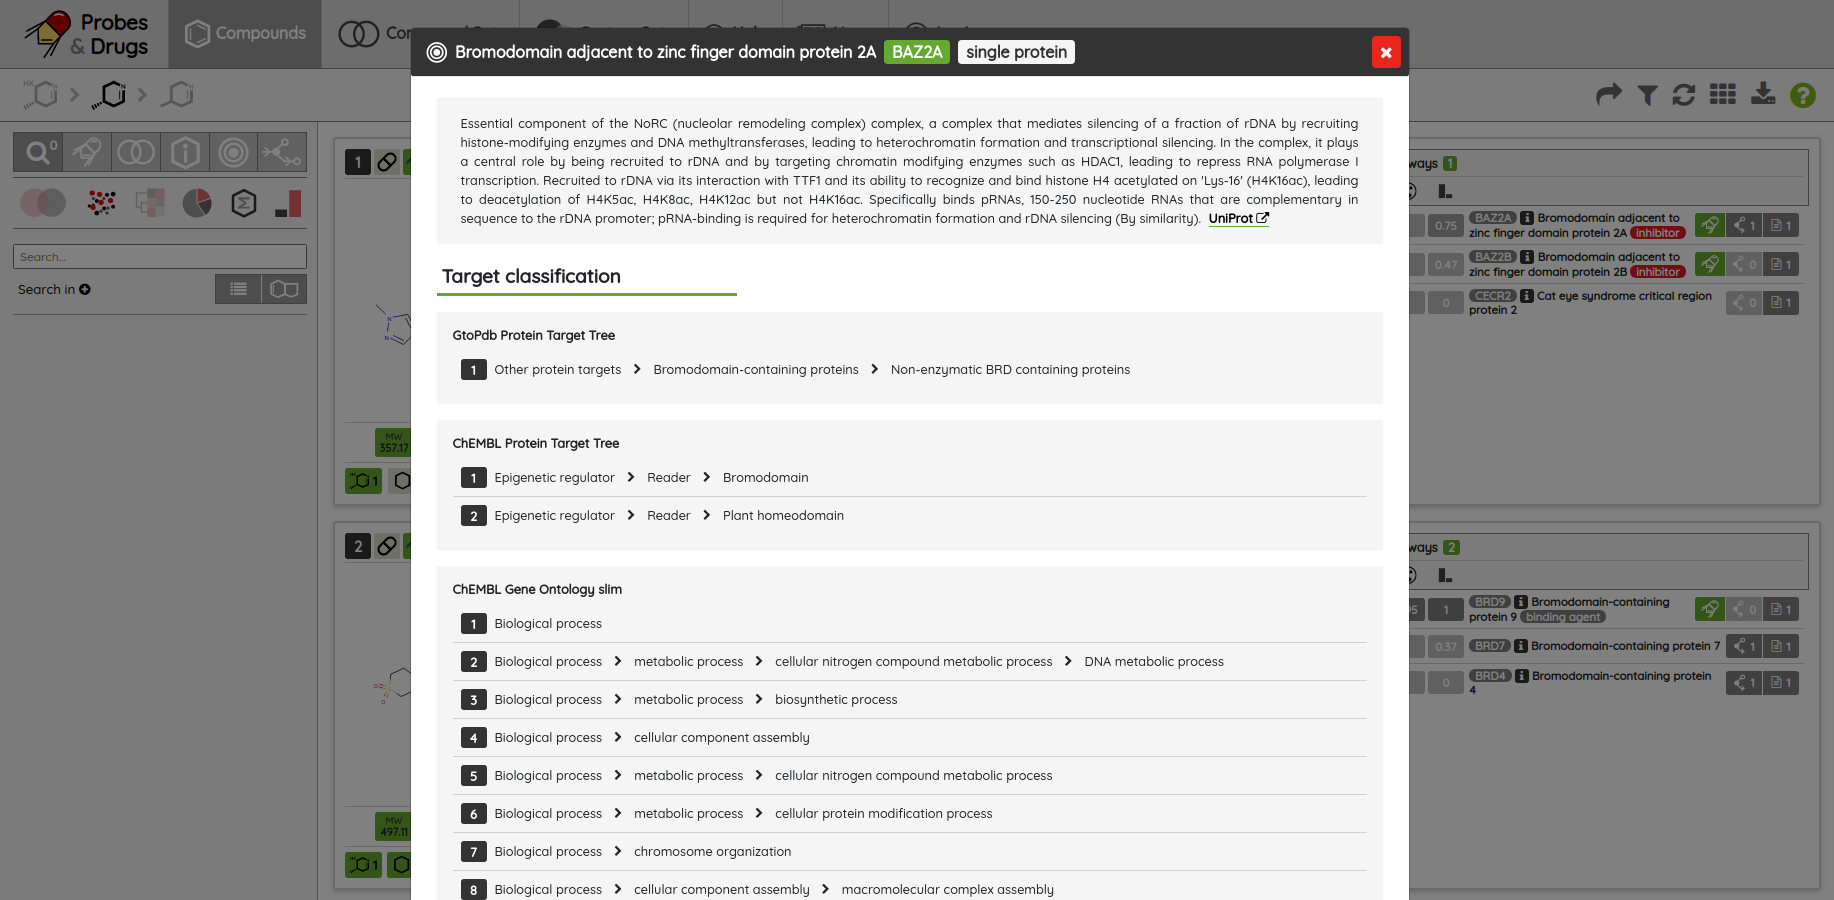
For most of the single protein targets, we also added a target card with the target description (UniProt), classification in available target trees (ChEMBL, GtoPDB, and Slim Gene Ontology), and a list of the underlying targets from different databases. To show the target card, just click on the information icon next to the target name.
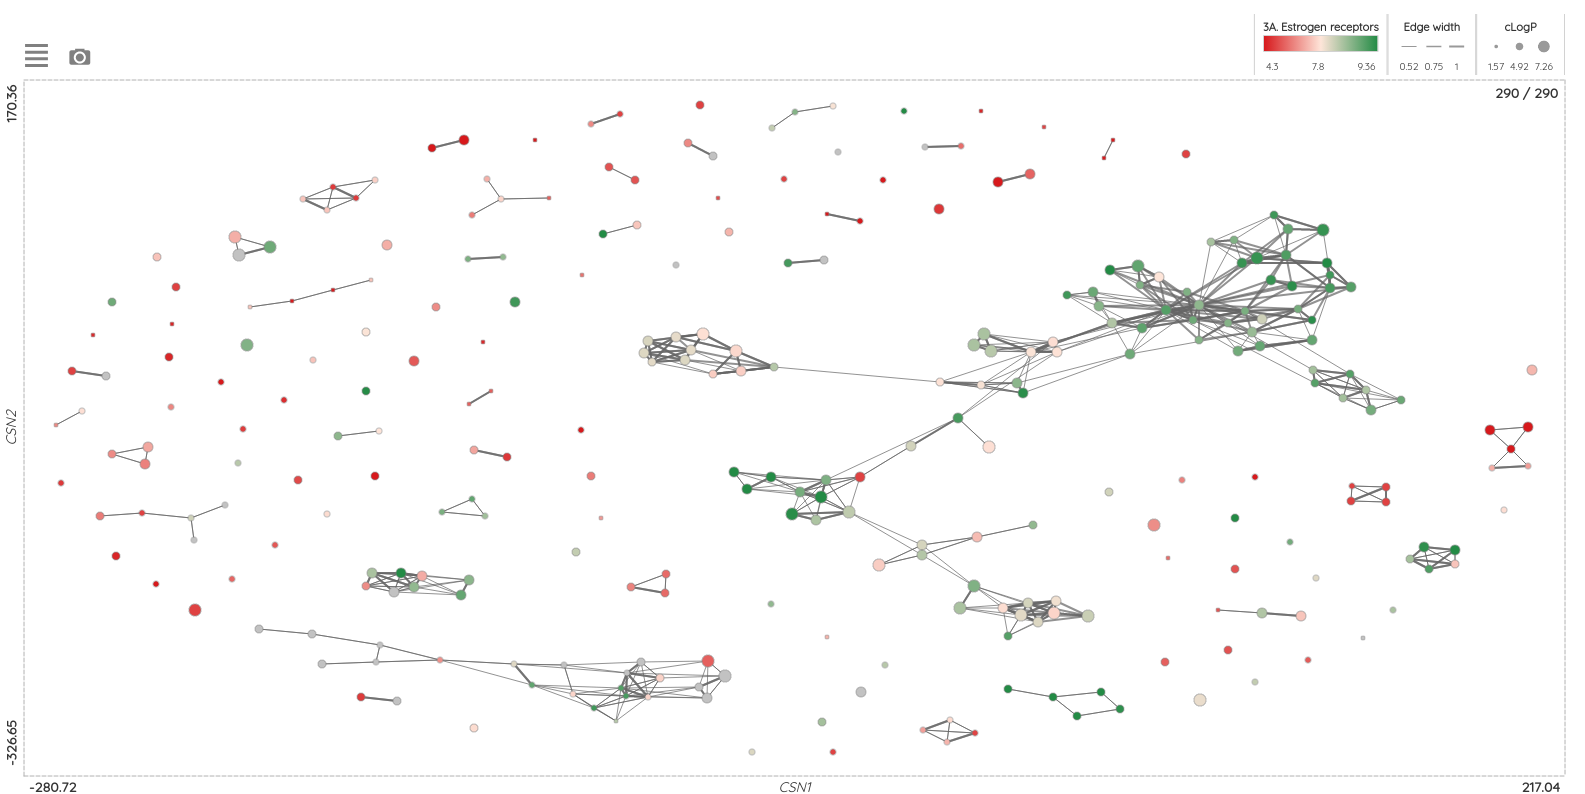
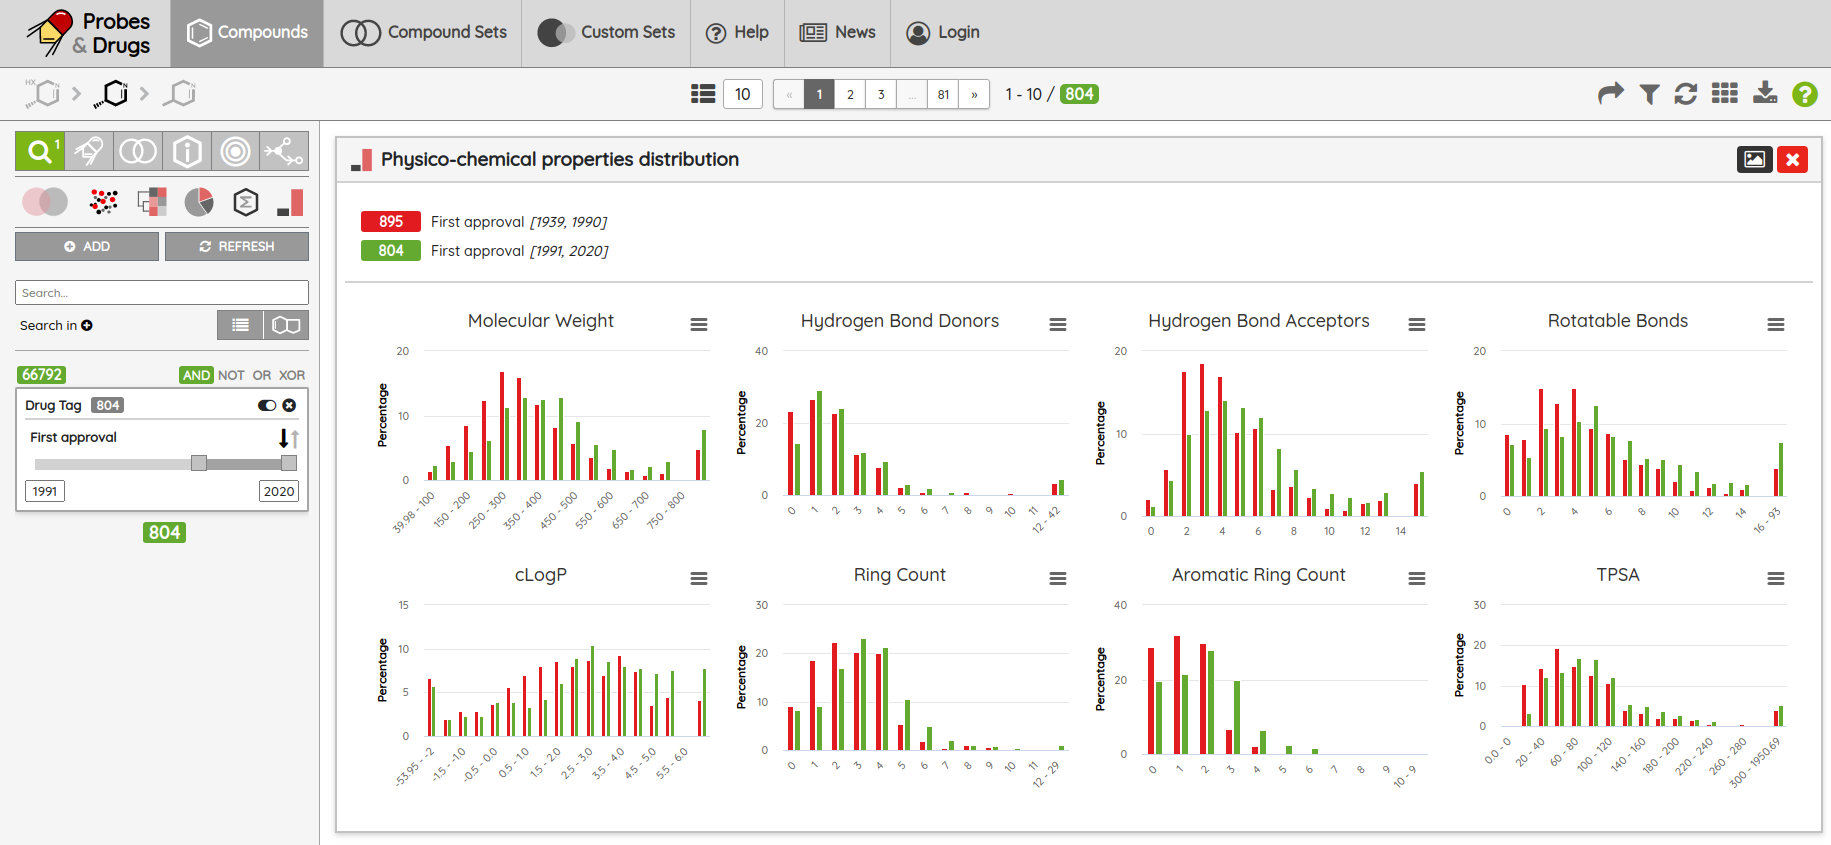
Another upgrade that you might notice is an improved UI for the visualizations, where you can now export the image of the whole visualization, and in physico-chemical properties distribution, you can use the add button to compare different filtered compound sets. For example, you can compare PCP distributions for approved drugs approved before and after 1990 (see the picture below):
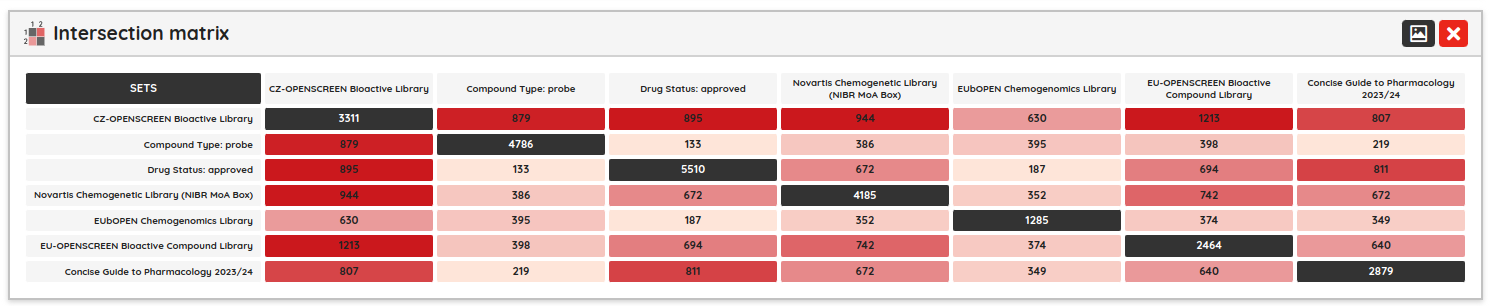
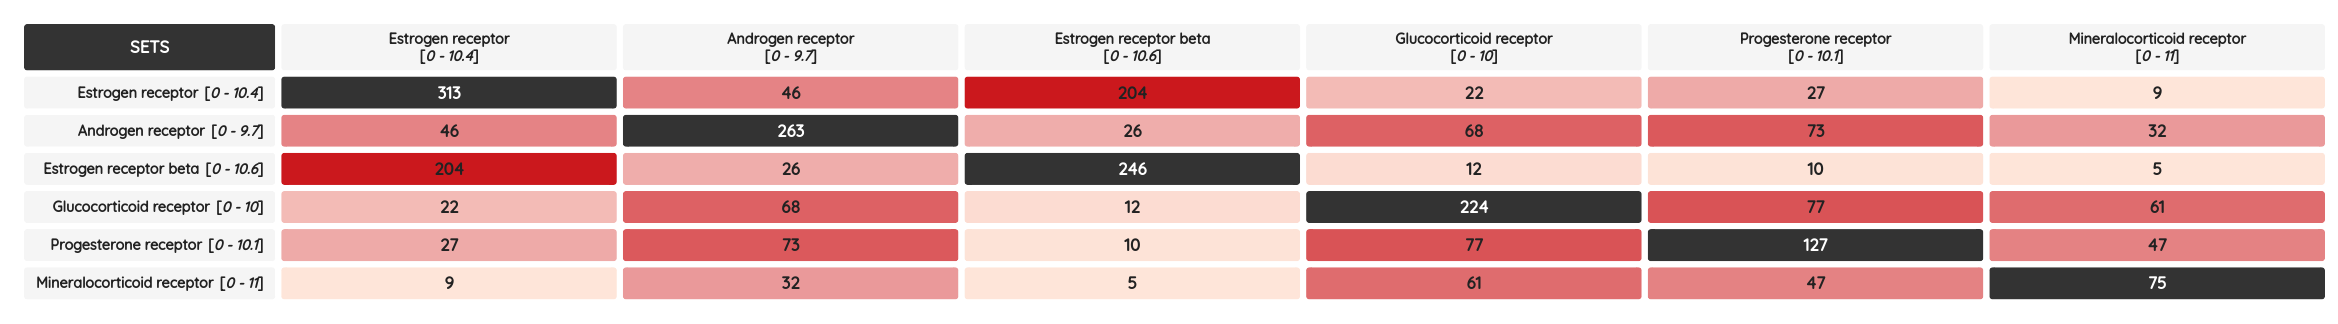
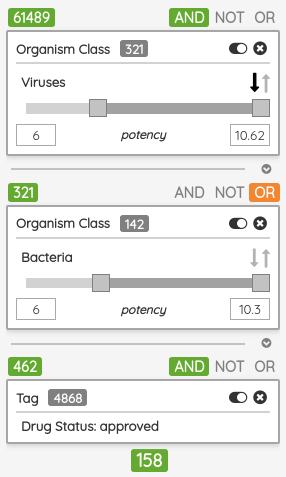
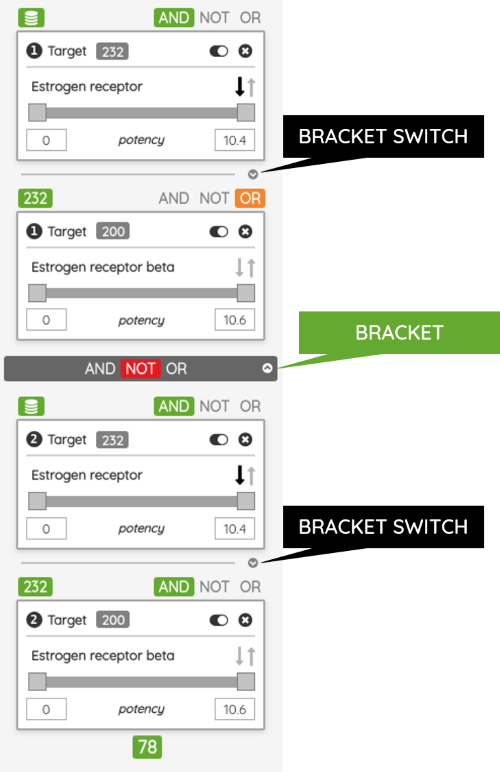
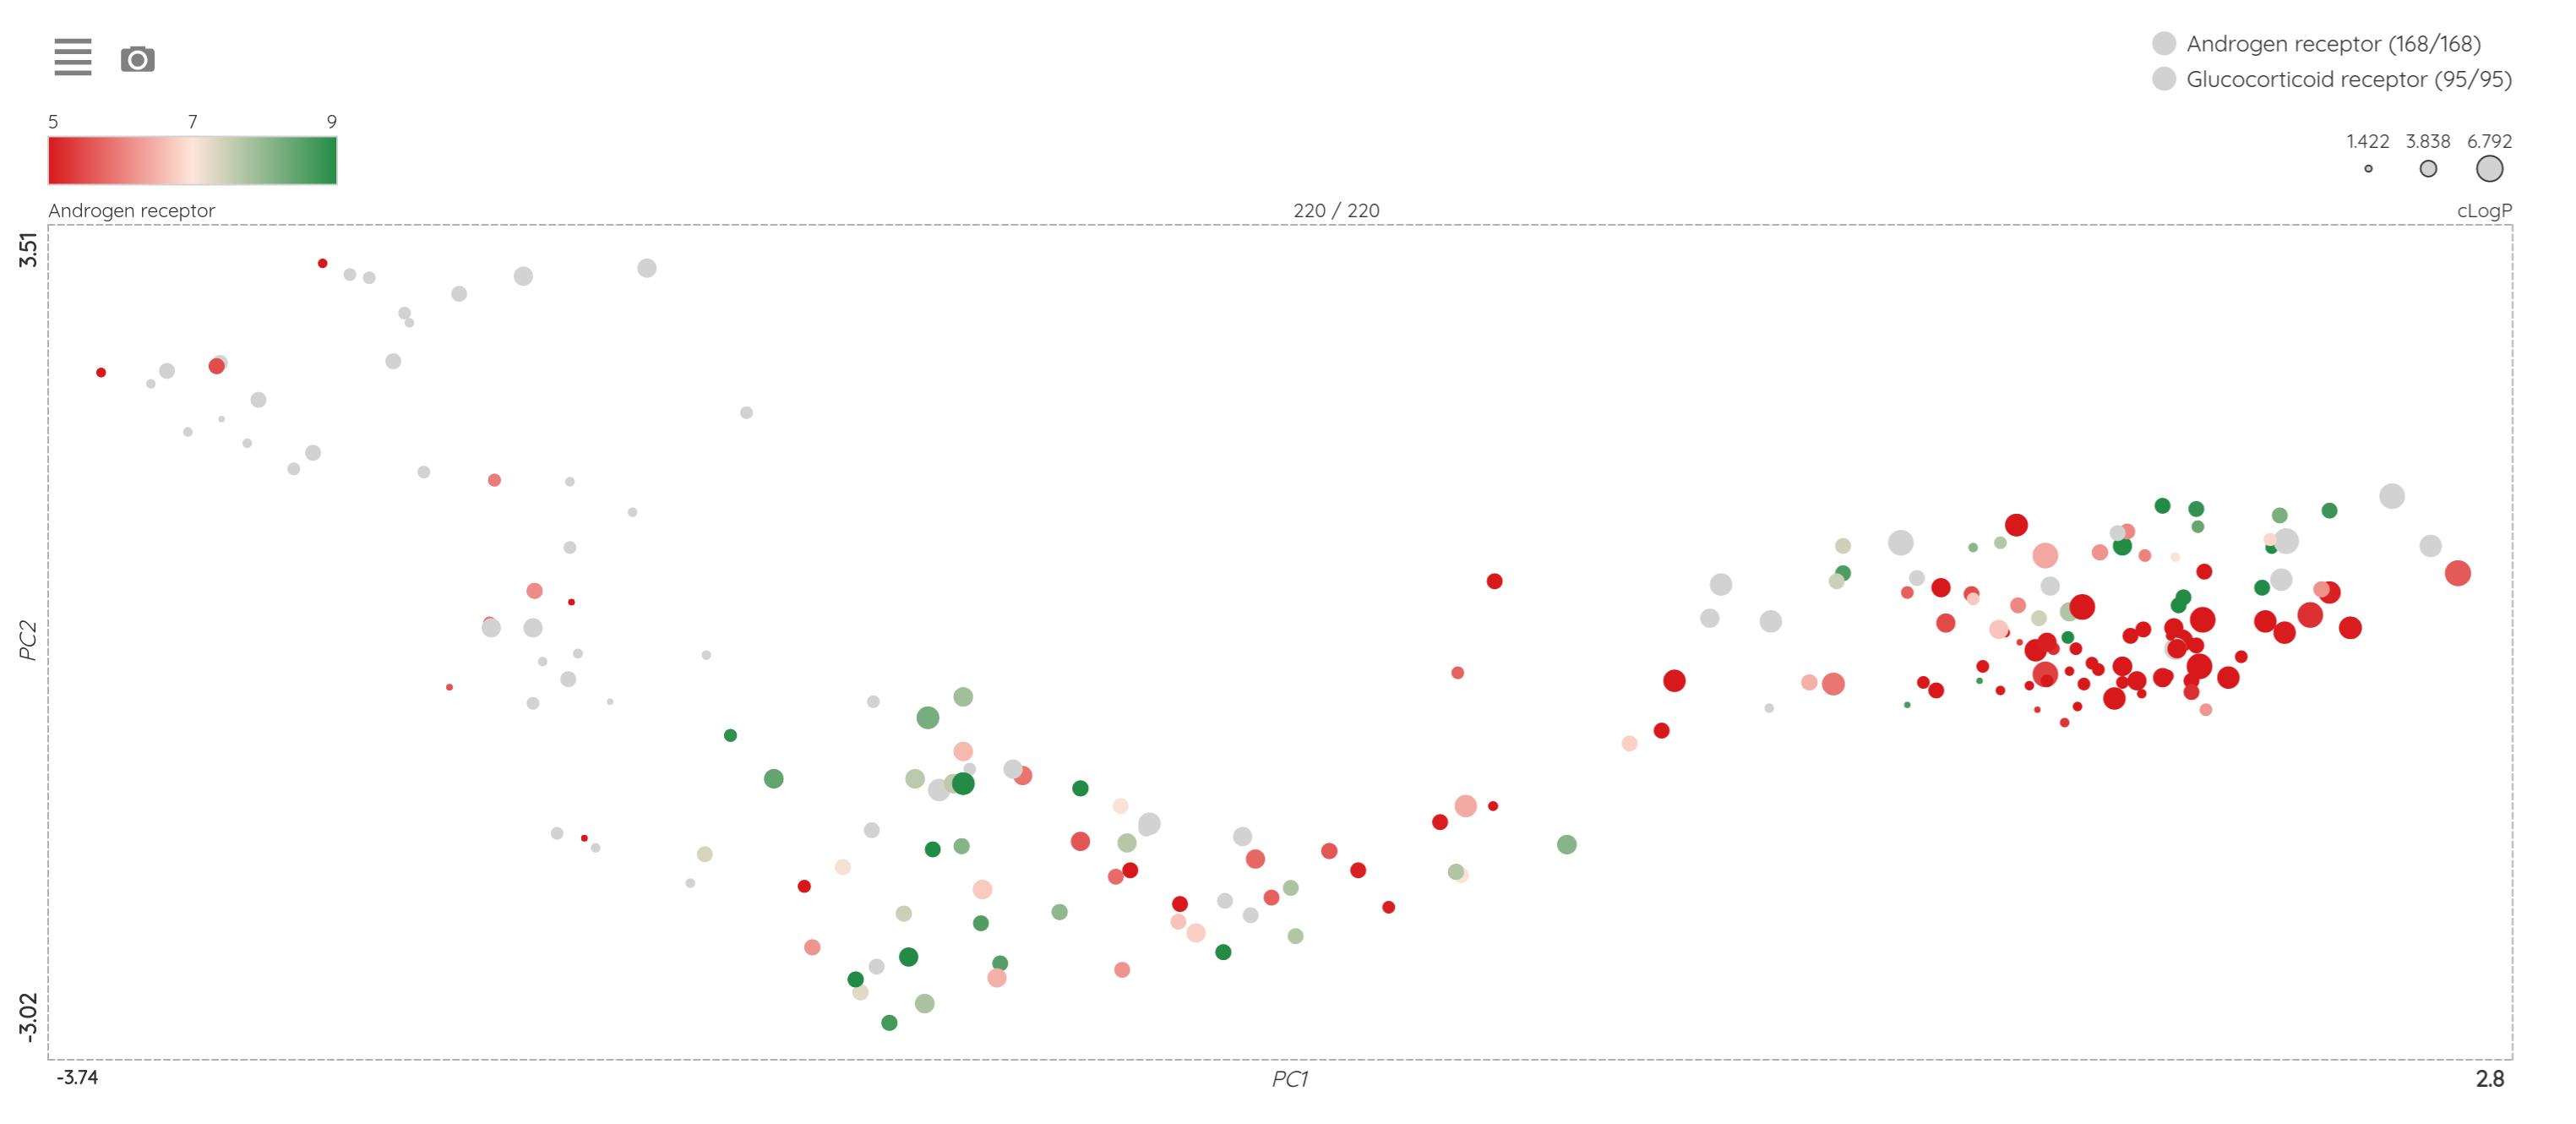
As a minor upgrade, we added the XOR (eXclusive OR) operator to the current Boolean operators. Using this operator, you can filter compounds that belong to one set or the other, but not to both of them at once. For example, you can filter compounds that bind selectively to Estrogen receptor alpha or Estrogen receptor beta, but not to both of them.
Finally, the database dump with all new data is as always available in the Download section of the portal and can be freely used under the CC BY-SA 4.0 license.
We hope you find the new data and features useful, and if you have any suggestions for new functions or compound sets we could include in our database, please, let us know through the contact form or through our Twitter account (@probesanddrugs).